Related Blogs

In a competitive IT industry, the primary challenge is to make the product available in the market for users so that they don’t opt for any other alternatives. The development of products is aimed to benefit the customers with great performance and latest technology. The developed product and its performance are good enough for users to make the best use of technology. Of course, most of the products/applications might be dealing with heavy data flow between back-end services and database servers.
An ideal and responsible team of dedicated software developers considers it a duty to write an efficient query that gives quicker and optimized results. Apart from that, we also have to optimize SQL queries which are performing slow and unable to give faster results.
SQL Server query performance tuning is seen as a primary concern because of the constant battle of database managers to achieve the highest performance and the lowest use of resources for their managed systems.
Using SQL Execution Plans as the first and foremost approach for any database administrator, we recall query output tuning. This is how the strategy advises us on what to tune. We demonstrate how the tasks are done internally with the execution of a road map presentation.
1. Best Practices for High-Performance SQL Queries
Before we jump into the execution plan, let’s go through some best practices to write high performing SQL queries.
- Perform the query for the required columns only, this would ensure that the db query is fired for the necessary columns and that no unnecessary columns are fetched, ensuring that efficiency and specifications are better fulfilled. Unless it suits the complete purpose, do NOT reply to queries.
- Subqueries should be avoided. Perform functions to join or write as needed.
- Utilize proper indexes (for faster search results).
- Often be aware of NULL events in your results.
- Often use table aliases where there is more than one source involved in your SQL statement. It increases readability, maintenance and assures that the proper columns are collected.
- In the ORDER BY clause, do not include column numbers. The main purpose of using this is for usability and scalability and not just performance. It might not be a concern while you create the database, but when time progresses and new columns are applied to the SELECT statement or whether you have used ColumnNumber, the original table is reordered. When you use ColumnNumber, then the results will be unpredictable and wrong in terms of ORDERBY.
- It is important to use INSERT statements in the column list. We advise this to help Software developers avoid the table modifications for the NULL values added to the columns. Thus the impact can be easily identified.
- For T-SQL code, never use double quotes.
- You should not use a prefix for stored procedures that starts with “sp_”.It is a syntax of the system that SQL provides us. It is advised to follow a unique pattern to name written procedures that can be differentiated easily.
2. What is SQL Execution Plan?
As discussed, the Execution Plan in SQL server management studio is a graphical representation of different operations performed by the SQL query processor. When you execute any query then the query processor will generate an execution plan along with the Query to be initiated. Identifying query workflow, operators, and components begins with query execution plans. SQL server provides three types of execution plans i.e Estimated plan, Actual plan and Cached plan but today we will be discussing two basic plans.
- Estimated Execution Plan
The moment you confirm the query to the SQL Server, the query optimizer will show a graphical execution plan that will display estimated execution plan time. This SQL Server database will take steps as per the query plan and you will receive the actual bill of the estimated execution plan.
- This type of plan is generated before executing the query or we can say during the compilation time.
- It is just an estimation by the query processor.
- No runtime information is provided with this.
- Actual Execution Plan
From the display window when you click on the actual execution plan, this gets activated. This plan is used to troubleshoot the concerns of performance during the query execution plan to improve and boost performance.
- This type of plan is generated once the query gets executed or we can say after the run time. The actual execution plan shows the steps SQL Server takes to execute the query.
- It is giving actual information by the query processor.
- It provides all information like which are the steps involved when we execute that query.
SQL Server Execution Plan Formats
The SQL Server Management Studio will generate a SQL Server execution plan in graphical format by default. However you have the option of viewing execution plans in three different formats:
- Graphical (generated by default)
- XML
- Text
3. How Do You Create a SQL Execution Plan?
An execution plan is generated when you execute any query which necessarily includes the query along with the plan. Running an execution plan for a particular query provides insights into the SQL Server query optimizer and query engine. It is possible to get an estimated SQL Server execution plan based on SQL Server statistics. There are many other ways to execute this plan. If we were to compare SQL then it would be with a mechanic. It works in the same way. Like a mechanic comes and checks your vehicle, then provides you with an estimation of plan based on his observation. There are other factors too that influence the plan such as vehicle health, time and material required, the cost that mechanic charges and so on. Similarly, SQL estimates the execution plan and later you can predict actual cost, time which may vary a little from actual SQL Server execution plans since it’s an estimation.
In SQL, you will use the Menu button, and toolbar buttons and shortcut keys. A SQL Server execution plan is important to check performance issues in the query execution. For more details, let’s get deep into the process below to know how to obtain the estimated and actual execution plans.
- Shortcut key: There is a shortcut key available to check for the Estimated Execution plan. You can press Ctrl+L after writing the query in the Query window.
- In the Context Menu of the Query Window, you will find a menu on the toolbar in SQL Server Management Studio with the name “Display Estimated Execution Plan”. It will work the same way as the above step will do. It will display the Estimated Execution Plan. Also, in the Query menu, there is an option available named “Display Estimated Execution plan”.
- In the toolbar, There is a button with this image.
 And this is exactly how the Actual Execution plan functions there is a shortcut key available for this and that is Ctrl + M.
(Note: If the button does not exist then check on Add or Remove Buttons. Also, in the Query menu there is an option available named “Include Actual Execution plan”.
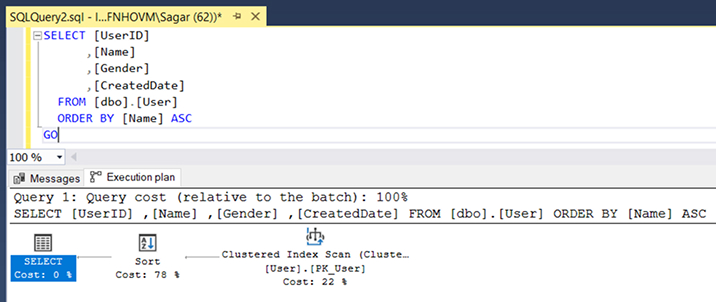
Estimated Execution Plans in SQL Server Management Studio Example
Actual Execution Plans in SQL Server Management Studio Example
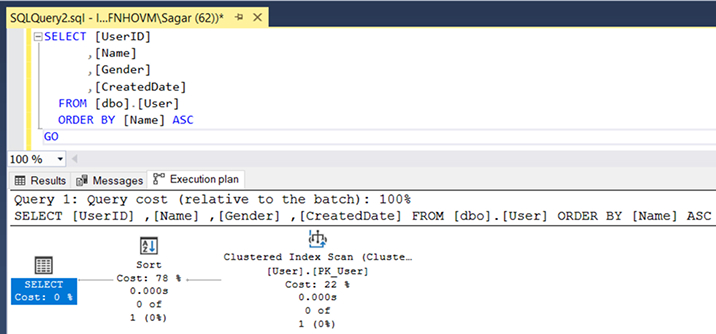
As you can see in the example it is showing the Actual Execution Plan in SQL Server Management Studio. We have executed the query and there are 3 tabs available. If you check the difference it will show you the time taken for the scan. There are 3 parts in which we can divide our execution plan.
- Clustered Index Scan (Clustered)
- Sort Operation
- Select Operation
4. What are the Components of the SQL Execution Plan?
As there is no data available in the table and it’s a simple query so the estimated execution plan and actual execution plan will be the same but if you go with the big queries then you will see the difference. You can use that to optimize your Query.
When you hover on the Clustered Index Scan there will be detailed results available. Have a look at the below screenshot.
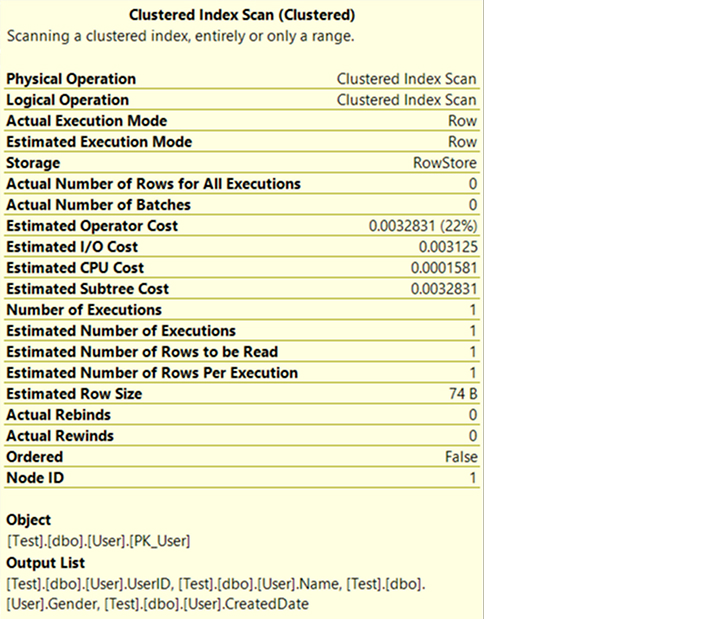
If you see in the image above, SQL has provided different details. We will discuss everything in detail.
- Physical Operation: Physical Operators are the objects that perform such operations. Some of the Examples are Index Seek, Clustered Index Scan etc. Logical Operators are giving direction to this kind of operator to perform the defined operations.
- Logical Operation: In Physical Operation, Our Software Developers use the work of Logical Operators. It also gives a clear picture of what query is necessary to process and how it will perform.
- Actual Execution Mode: This section will portray the actual plan to be executed. It is used by the Processing engine and for executing the query.
- Estimated Execution Mode: It is similar to the above plan but the only difference is it is showing estimated value.
- Storage: The output fired by the query is like an optimizer extracted from the query.
- Legit facts and figures for all executions- The actual plan will show all the real figures and numbers in the execution plan. Based on the condition that will give us no records and no returns.
- Actual Number of Batches: This will exist only in the Actual execution plan. If it’s a Batch query then it will return No of Batches.
- Estimated Operational Cost: If there are any other operational costs involved in our query then it will do the calculation for that and will be displayed here.
- Estimated I/O Cost: It shows the accurate number of input and output costs of the result set.
- Estimated CPU Cost: It estimates the cost to execute the operations with the CPU.
- Estimated Subtree Cost: When the Execution plan is generated then it generates Tree. From now, you’ll be able to calculate
- Number of Executions: This will exist only in the Actual execution plan. In the single batch, the number of executions that can be handled by the Optimizer.
- Estimated Number of Execution: Similar to the above one but the only difference is that it will give you the Estimated value.
- Estimated Number of Rows per Execution: This is just an estimation from Optimizer that how many rows are going to be returned.
- Estimated Number of Rows to be Read: This is just an estimation from Optimizer that how many rows are going to be read.
- Estimated Row Size: As the name suggests, it is showing you the estimated row size of the storage.
- Actual Rebinds- This will be active during the actual execution plan. It gives information like how many times an object must be reevaluated to process.
- Rewind Actual numbers: This part will be repeated in the actual execution plan again.
- In correlated operation, the total number of rows is executed by using inner result datasets repeatedly.
- Ordered: It determines if the dataset on which operation is performed has implemented sorting or not. If you check in the above example it is giving you False because till now sorting is not done. Once sorting will be done then it will be true.
- Node ID: This follows a unique type of numbering from Right to left and then the usual Top to bottom. So, we can say that the Bottom Right will have NodeID=1 and the Top Left has Maximum Node based on the Execution Plan Tree.
In Addition, there are two more components. We can check its information below.
- Predicate: It is the value returned by the WHERE clause of the SQL statement.
- Object: Defines the Table on which we have performed that query or operation.
- Output List: Defines the selected columns which will be displayed in the Dataset or result set.
Search Data in the Table
We are now going to delve deeper into this with an example so before we begin let’s brush up our knowledge about indexes and comparison between those.
Table Scan: In this type of scanning, the scan is comprehensively executed in a way that it touches every row of the table, irrespective of whether it qualifies the given search result or not. This type of scan is an efficient way to check a small table in which the majority of the rows would qualify for the predicate. The estimated cost would be proportional to the total number of rows in the table.
Index Scan: If the table has a clustered index, then the executed query should cover all the rows and columns. So, it is advisable to fire a query that would cover most of the rows or almost all the rows of the table. I.e. a query without a WHERE or Getting clause, the index search would be used. In the process of database optimization, the query optimizer chooses the best one from the available index. And based on that information, the clause functions are clearly defined when the whole table is scanned.
This clause keeps the statistical information of the database.
The moment you choose the right index. The immediate next step is to navigate the tree structure to all the matching data points and using SQL Query processor or engine extract the exact records.
One of the major differences between a full table search and an index scan is that when data is sorted in the index tree, the database engine understands when it has reached the limit and still looks for that. It can then submit the question or, if appropriate, pass on to the next data set.
Index Seek: The cost is directly proportional to the number of qualifying rows and pages, rather than the total number of rows in the table, since only qualified rows and pages containing these qualifying rows are affected by a search of these three, this is the quickest one.
5. How Do Execution Plans improve SQL Server Query Performance?
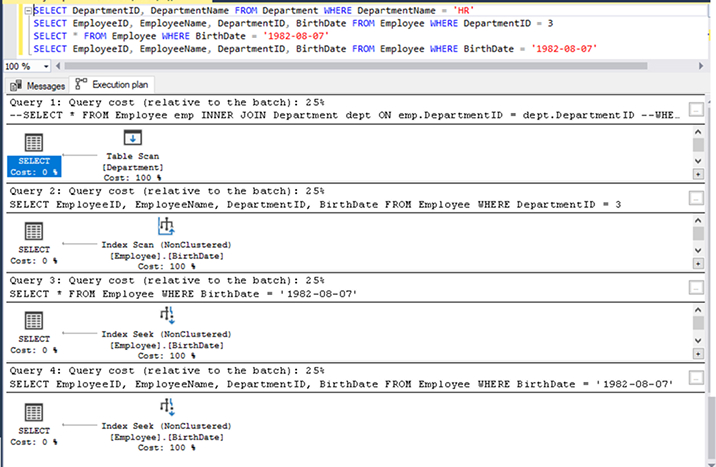
From the above image displayed in the execution plan, there are 4 different queries with some minor changes. Let’s take a look at each of these one by one and try to understand what improvements we can make by observing execution plans.
Query 1: SELECT DepartmentID, DepartmentName FROM Department WHERE DepartmentName = ‘HR’
This is a table that does not have any primary key defined and hence it does not have any clustered index created. This performs a complete table scan which is visible in the first execution plan. This query takes the maximum time if the number of records in the table are in millions.
Query 2: SELECT EmployeeID, EmployeeName, DepartmentID, BirthDate FROM Employee WHERE DepartmentID = 3
This query is performing the Index scan which is little faster than a table scan as it would be bringing data in the sorted order the way it was stored through the clustered index. It will still be slower if the table is having huge data.
Query 3: SELECT * FROM Employee WHERE BirthDate = ‘1982-08-07’ I have created a non-clustered index on the BirthDate column as visible in the first image above. Please note that the columns are shown in the included tab in the image below. This means, the index seeks can only be performed if there are many columns selected in the select clause and WHERE clause is on the Birthdate column.
Still the third execution plan is showing Index scan. Confused! Please refer to the first bullet point in the best practices section to get high performance. You can In the SELECT clause we have written * and not the specific columns. This has prevented index seek ability and we didn’t receive the desired performance that was expected. In spite of creating a non-cluster in the database. Now, let’s check the final query.
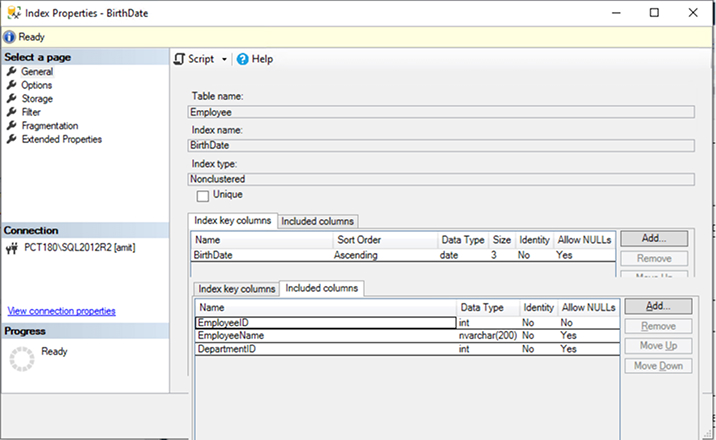
Query 4: SELECT EmployeeID, EmployeeName, DepartmentID, BirthDate FROM Employee WHERE BirthDate = ‘1982-08-07’
You will note that the Index seek has been used for this query as we followed the best practices and we have non-clustered indexes created accurately.
To identify performance improvements, one should be aware of best practices and in-depth knowledge about the SQL server. The execution plan helps to find out missing things by its graphical representation so one could easily find out the action items to improve performance in a particular query. I hope this example would have given the idea about how to find out improvements in the query.
6. Conclusion
In this article, we did extensive research and gained insights into the Execution plan. Some of the secret strategies were known on how to produce the execution plan, the discrepancy between the projected execution plan and the real execution plan, and various components of the execution plan nodes. Also, we learnt about how execution plans help to find improvements in the query. This tool has been very useful for the DBA to deal with day to day challenges and when there is a big data concern so you can check the execution plan again and optimize the query whenever needed.
More Useful Resources:
How to Configure Database Mirroring for SQL Server
How to compare two SQL Server Databases using SQL Server Data Tools

Vishal Shah
Vishal Shah has an extensive understanding of multiple application development frameworks and holds an upper hand with newer trends in order to strive and thrive in the dynamic market. He has nurtured his managerial growth in both technical and business aspects and gives his expertise through his blog posts.
Related Service
Custom Software Development
Know more about our Custom Software Development Service
Learn MoreAbout Custom Software DevelopmentSubscribe to our Newsletter
Signup for our newsletter and join 2700+ global business executives and technology experts to receive handpicked industry insights and latest news
Build your Team
Want to Hire Skilled Developers?



Comments
Leave a message...