Related Blogs
One of the best online marketing tools to track website performance used by organizations worldwide is Google Analytics. It helps businesses to achieve online marketing goals without any effort and seamlessly. It facilitates digital marketing teams to determine the audience’s navigation and behavior i.e. the way they interact with the website graphics and content. It also helps the firms to discover which keywords or search terms were used to visit their site, which pages and artifacts attracted most of the audiences, and what percentage responds to call-to-action.
If you are a SharePoint developer and want to learn about Power Analytics then you must know that Power Analytics is a strong amalgamation of Power BI + Google Analytics, let’s dive into it for more detail.
1. What is Power BI?
Microsoft’s Power BI is the industry-leading business intelligence product. It is used to link data sources in order to model and display data in a way suitable for reporting.
The primary advantage of combining Power BI and Google Analytics is the ability to consolidate data from several sources.
2. What is Google Analytics?
Google Analytics is a web analytics solution that offers basic analysis tools and information for search engine optimization (SEO) and advertising reasons. The tool is included in the Google Marketing Platform and is accessible to everyone who has a Google account for free.
Google Analytics is designed to monitor website efficiency and gather demographic information about visitors. It can assist businesses in determining the primary sources of user traffic, evaluating the excellence of their promotional events and activities, tracking goal completions (such as purchases and adding products to carts), identifying patterns and trends in user participation, and obtaining additional visitor data such as demographics. Small and medium-sized retail websites frequently utilise Google Analytics to collect and analyse numerous types of consumer behaviour data that can be used to optimise marketing efforts, drive more traffic, and enhance visitor retention.
3. What can Google Analytics and Power BI Offer Together?
It is highly critical to analyze and track your site’s traffic in this marketing age. Knowledge of your audience’s location, day and time of their visit, frequency of their visits and time spent on your site are some of the parameters which may help you improve your site and bring you closer to your marketing objectives.
Most organizations use Google Analytics to track marketing goals and obtain insights into ways of improving website performance. Using Google Analytics data in Power BI, it has become a driving force to unpack hidden ways that focus on completely new opportunities and suggest innovation in the marketing world in a way to attract new customers.
Google Analytics does a fabulous job of tracking site visitor behavior, such as the number of unique page visits, time spent on a site, and geographic location of users. But Google Analytics fails to offer a lot of analytic tools for connecting marketing data to data from other sections of an organization, or to external data trends that are luring a considerable marketplace.
That missing value is added by Microsoft Power BI and by using Power BI you can –
- Draw a comparison between data from Google Analytics data and data from other sources of organization, internal and external.
- Import data from SharePoint, HDInsight, Azure Marketplace, Exchange – or even Facebook, Wikipedia, and Data.gov.
- Determine web performance data, by importing data from various sources such as Salesforce, Marketo, SharePoint or more.
- Enable team members to achieve a more specific view of your organization’s performance.
Most of the users utilize Microsoft Power BI for its dynamic visualization tools and insights and it is quite exciting. Anyway, it’s a great place to measure your site performance but one thing that catches people’s eye for real-time data visualization, uncovering multiple trends and patterns of usage.
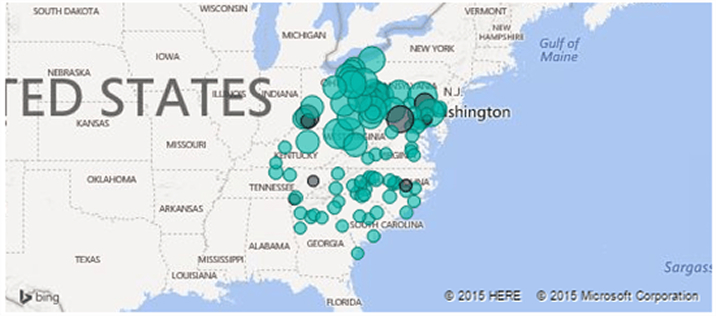
Consider, for instance, using Power BI map visualizations. They are helpful in tracking the following actions:
- Enable you to track site visitors’ locations worldwide and over time. You can drill down a location to track more detail regarding a user’s region.
- Analyze website traffic at a specific place over time. Zoom in / zoom out and pinpoint a location where traffic exists.
- Cross-check the day and time of visits in different regions against contemporaneous events.
- Is the increase in website traffic proportional to a local conference or sales announcement? Based on this insight, you can better expect when people will browse through your site, enabling you to add relevancy in terms of data to generate interest in your products or services.
- If you are using Google Analytics to track site usage and events occurring in your site and digital measurement, there is some great news for you.
4. Connecting Power BI with Google Analytics
Using Power BI Desktop, software developers can explore and visualize data in the Google Analytics content pack. By using Google Analytics data in Power BI, you can immediately connect and gain insights into your data and site usage in the last 6 months, allowing you to build custom reports. How to perform this action is mentioned below.
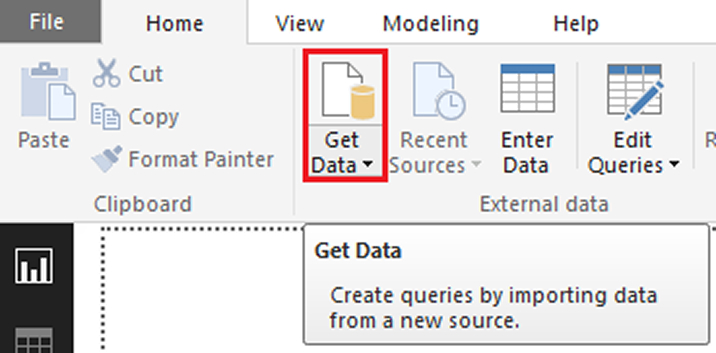
- In the top navigation pane of the Home ribbon tab, click Get Data.
- From the list of online services, select Google Analytics, and then click Connect.
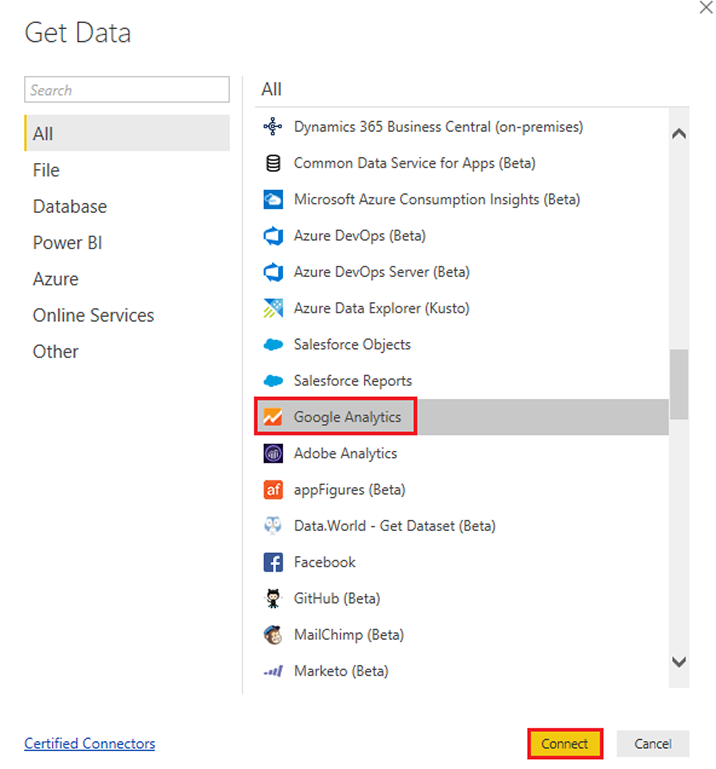
This connector uses the Google Analytics API, allowing you to access Google Analytics data after enabling Google Analytics for your site. On selecting it from the menu of online services sources, it will ask for your credentials and allow Microsoft Power BI to access your account.
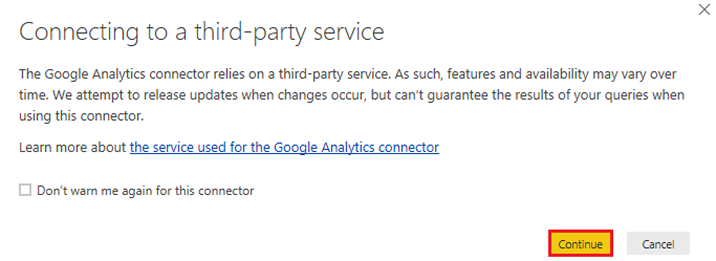
- Read the information for connecting to a third-party service, and then click Continue.
- Sign in to your Google Analytics account and pass your credentials in the next group of prompts.
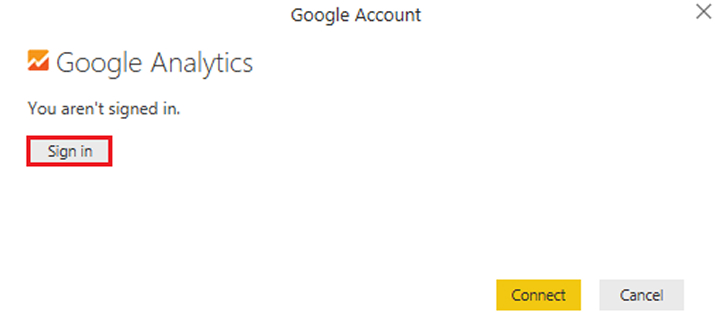
- Google Analytics approaches Power BI Desktop for permission to connect to your data. Hit Allow.

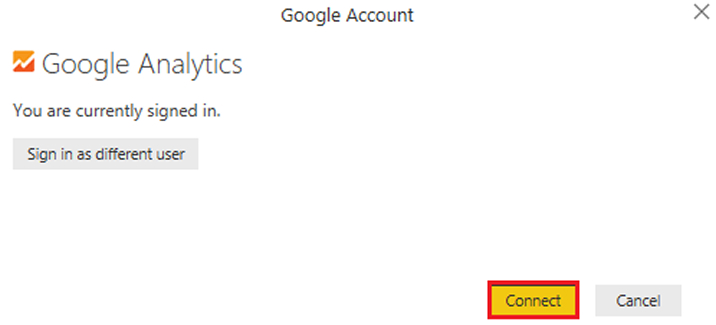
- Power BI Desktop shows that you’re signed into Google Analytics. Click Connect to load your Google Analytics data.
- Once you connect Google Analytics with it, you’ll see a list of the accounts you have access to. Scroll through the Google Analytics account, properties, and views to see a selection of values, categorized in display folders. Select the property and view inside the navigator that you want to connect to and click Load.
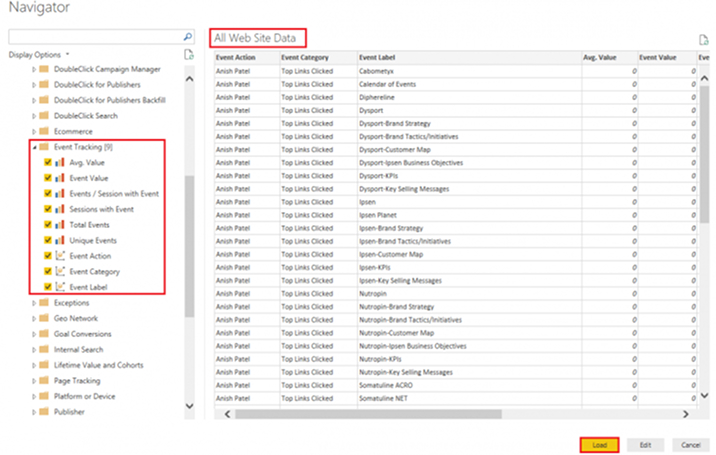
As you select different values, Microsoft Power BI will send a query back to the source to get results. The output will be a single flat table with all the values selected. Google Analytics has a limit on the number of items you can select together, so select the initial set and build as needed.
Additional operations, such as filtering on the data will also be sent to a query in Google Analytics. After loading the tables or switching to the Report view, you’ll be able to visualize and explore your data.
- Power BI Desktop loads data from Google Analytics. Now you can start creating your astounding dynamic reports, same as Google Analytics dashboard.

- Publish Power BI report to your Power BI account on the web.

- Choose a destination and then click Select.

Note: If you already have the same dataset in Power BI, replace it with the updated dataset.
- Select File and click Save As to download a report from Power BI Desktop to your preferred location.

- Provide File Name as PowerBI+GA. The extension for files being exported using Power BI Desktop is .pbix.

5. Embed Report Power BI Web Part in SharePoint Online
SharePoint Online is a crucial part of the any business communication strategy. With the introduction of Microsoft Power BI, this need has been fulfilled. It has now become the need for an hour. Using Power BI’s new report web part for SharePoint Online, SharePoint developers can easily embed interactive Power BI reports in SharePoint Online modern pages infrastructure with no code required.
When utilizing the new embed SharePoint Online option, the embedded reports are completely secure with easy and secure creation options in internal portals.
Requirements
For Embed in SharePoint Online reports to work, the below is the pre-requisites:
- A Power BI Pro license or a Power BI Premium capacity (EM or P SKU) along with a Power BI license.
- The Power BI web part for SharePoint Online needs Modern Pages.
Embed your report
To embed your report into SharePoint Online, SharePoint developers have to capture the report’s URL and utilize it with SharePoint Online’s Power BI web part.
Get a report URL
- Log in to Microsoft Office 365 portal and open Power BI under the list of available apps.

- Within the Power BI app in Office 365, view the report by importing the .pbix file. From the left navigation pane, click Get Data.

- Click Get in the Files box.

- Select Local File and open PowerBI+GA.pbix file created earlier.

- Choose the Embed in SharePoint Online from the File dropdown menu.

- From the dialog, copy the report URL.

Add the Power BI report to a SharePoint Online page
- Open the target modern page in SharePoint Online and select Edit.

- Click the + icon button and then select the Power BI web part.

- Click the Add report.

- Paste the copied report URL into the Power BI report link pane. This will enable users to load the report automatically.

- Select Publish to roll out the change noticeable to your SharePoint Online users.

Note:
- A Power BI Pro license is must require for publishers of the Power BI report. On the off chance that the report is not deployed on a Power BI Premium Capacity, the report viewer’s need a Power BI Pro license. If they don’t have that license then they need to sign-up for Power BI or begin a 60-day free trial of Power BI.
- Embedding a report in SharePoint Online does not consequently give users permission to view the report, regardless of whether the users have permission to view the page. The authorizations to view the report are set within the Microsoft Power BI service. So, the user must have access to both the SharePoint Online site as well as the Power BI report to view the report on the page.
- The Power BI (preview) web part for SharePoint Online does not yet supplement screen readers or keyboard navigation.
Multi-factor authentication
In the event that your Microsoft Power BI environment expects you to sign in using multi-factor authentication, you might be asked to sign in with a security device to confirm your identity. This happens if you did not sign in to SharePoint Online utilizing multi-factor authentication. However, your Power BI environment requires a security device to validate the account.
Note: Users will see an error message as Power BI did not support the multi-factor authentication with Azure Active Directory 2.0. On the off chance that the user signs in again to SharePoint Online using their security device, they might almost certainly view the report.
Web part settings
Below are the properties a SharePoint developer can adjust in the Power BI web part for SharePoint Online.

| Property | Description |
|---|---|
| Power BI report link | It helps users to display reports from Power BI by adding the link here. |
| Page name | This property sets the web part’s default page. From the drop-down, choose a value. If no page is displayed then either your report has one page or the URL you pasted contains a page name. Expel the report section from the URL to select a specific page. |
| Display | This web part property tunes how the report fits within the SharePoint Online page. |
| Show Navigation Pane | The page navigation pane is displayed or hidden through this web part property. |
| Show Filter Pane | The filter pane is displayed or hidden through this web part property. |
Report that do not load
There are two common reasons why the report does not load in SharePoint Online Power BI web part:
- Either you do not have access to the report in Power BI.
- Or the report was removed/deleted.
You should contact the SharePoint Online page owner to get assistance in resolving the issue.
6. Conclusion
The two strong associations of Power BI + Google analytics will provide businesses with extraordinary and unexpected results. Microsoft Power BI makes it easy for anyone to connect to huge amounts of structured and unstructured data from numerous sources. The data in Power BI tool manipulates the data which is imported from Google Analytics by representing it in a visual analytics manner. This is represented with regards to multiple factors. One can easily and effectively share the Google Analytics data in this format with their connections and associates. If a SharePoint development company has more sources of data and has a correct tool to analyze and envision them so that one can extract the significant bits of knowledge.
Crunch the numbers!!! Add Google Analytics to Power BI and watch the insights more precisely with Power Analytics.

Shital Patel
Shital Patel is VP at TatvaSoft with a high-level of proficiency and technical precision in SharePoint Development. His experience of the last two decades has helped businesses to solve complex challenges resulting in growth and performance of Startups to Fortune 500 companies.
Subscribe to our Newsletter
Signup for our newsletter and join 2700+ global business executives and technology experts to receive handpicked industry insights and latest news
Build your Team
Want to Hire Skilled Developers?





Comments
Leave a message...